Tutorial
Hybrid Human Artificial Intelligence 2023
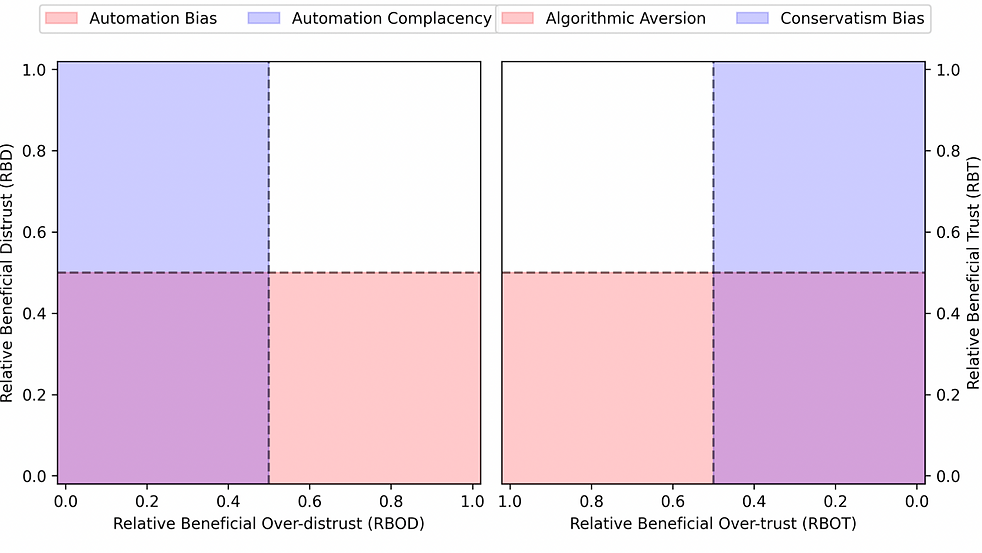
Figure 1. An empty Reliance Pattern Diagram
In this tutorial, we will focus on the fit between human decision makers and AI support in classification tasks, in order to assess the extent humans rely on machines, and
the effects of this relationship in the short term of decision efficacy and confidence (then, purposely neglecting any long-term effect, such as complacency, alienation, deskilling,progressive delegation). In particular, we will introduce and illustrate a general methodological framework that we recently proposed to gauge what there called “technology dominance”.
Technology dominance is "the dominating influence that technology may have over the
user, which allows the user to take a more subservient position — in essence, the user
deferring to the technology in the decision-making process."
To this aim, in the tutorial we will present, and discuss the rationales behind, the framework of the reliance patterns, that allows to distinguish between positive and negative dominance, and the related biases, such as automation bias, algorithm appreciation, and a phenomenon that deserves more attention: the white-box paradox (shortly put, whenever automation bias is influenced by the provision of explanations).
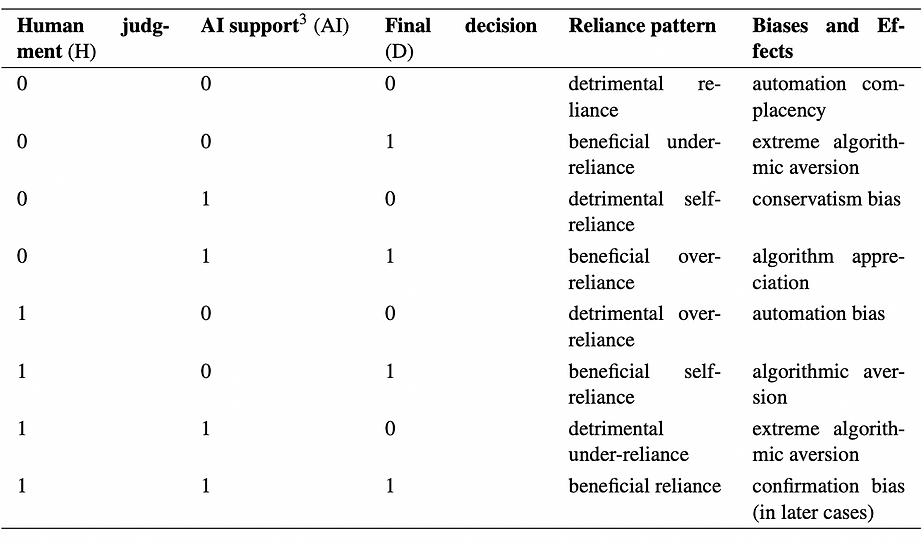
Table 1. Definition of all possible decision- and reliance-patterns between human decision makers and their AI system. In the first three columns, 0 denotes an incorrect decision, and 1 a correct decision. We associate th attitude towards the AI in each possible decision pattern, which leads to either accepting or discarding the AI advice, and the main related cognitive biases.
We will then illustrate a set of methods for the quantitative and qualitative assessment of technology dominance,
which encompass both metrics and data visualizations
(see the tables and figures below).
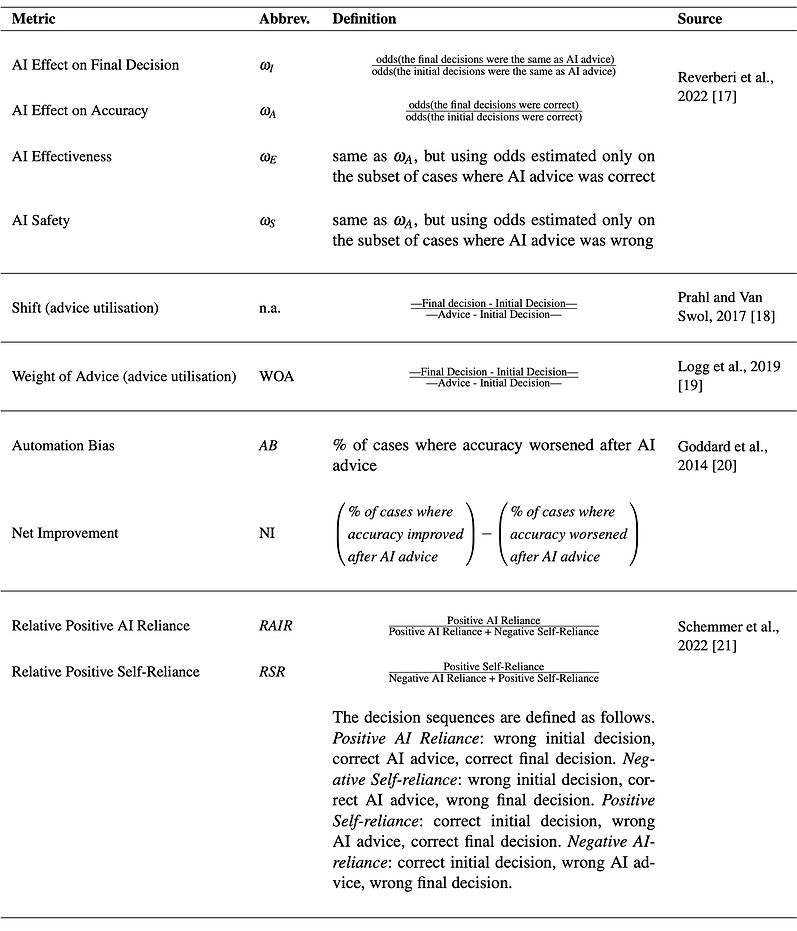
Table 2. Literature review of metrics useful for the assessment of technological dominance
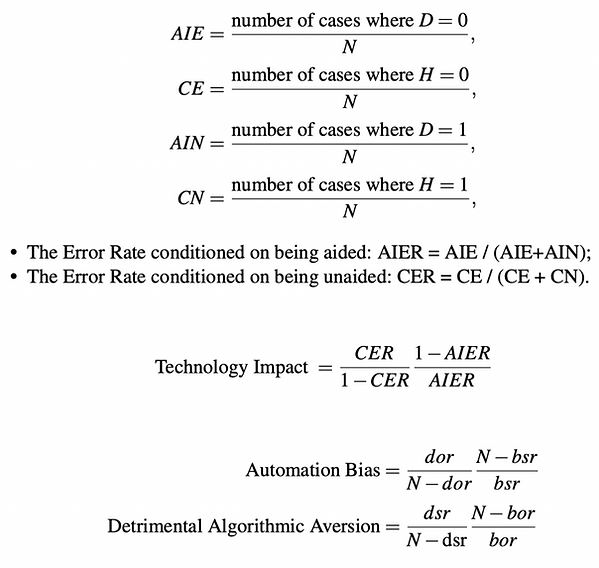
Figure 2. The metrics developed by MUDI Lab for the assessment of Human-AI reliance
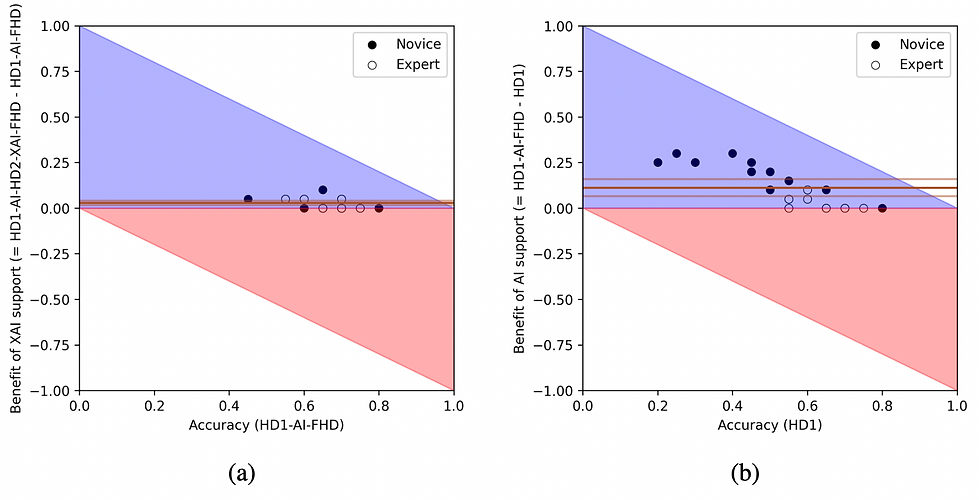
Figure 3. Example of Benefit Diagrams to visually evaluate the benefit
coming from relying on AI (a) and XAI support (b), respectively.
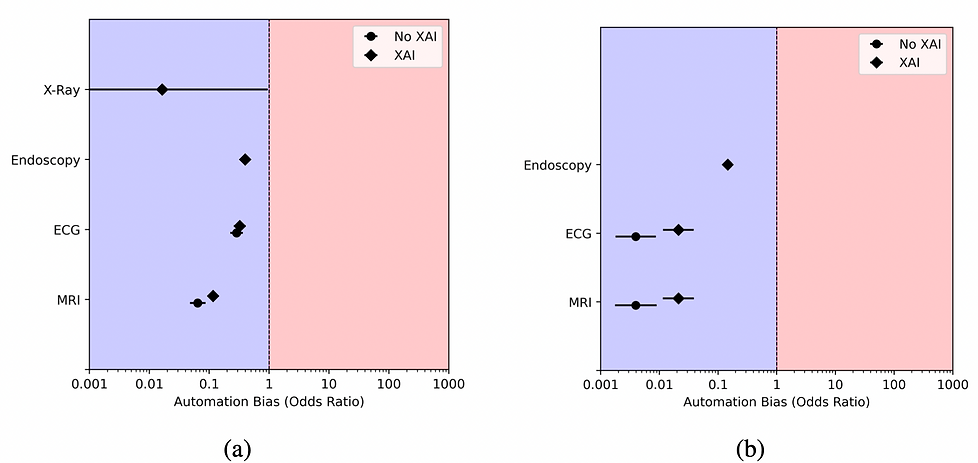
Figure 4. An example of Automation Bias odds ratios, for the 4 considered case studies:
on the left, (a) the frequentist metric; on the right, (b), the causal metric.
We will also distinguish between a standard statistical approach and a causal analysis-based approach that can be applied when additional information is available about the context of interest. Finally, we will illustrate the use of the proposed methods by applying them in several user studies from a variety of settings, by also demonstrating open source software and tools that we developed to this purpose to be adopted by the community of interested scholars and researchers.
Tutorial format